Power BI is a suite of business analytics tools to deliver interactive visualizations, business intelligence capabilities and insights from hundreds of data sources.
Power BI Desktop is a free authoring tool that lets you connect to, transform and visualize your data. It is updated monthly with new features. Download and install Power BI Desktop from Windows Store to make sure that it will automatically be upgraded when a new version becomes available.
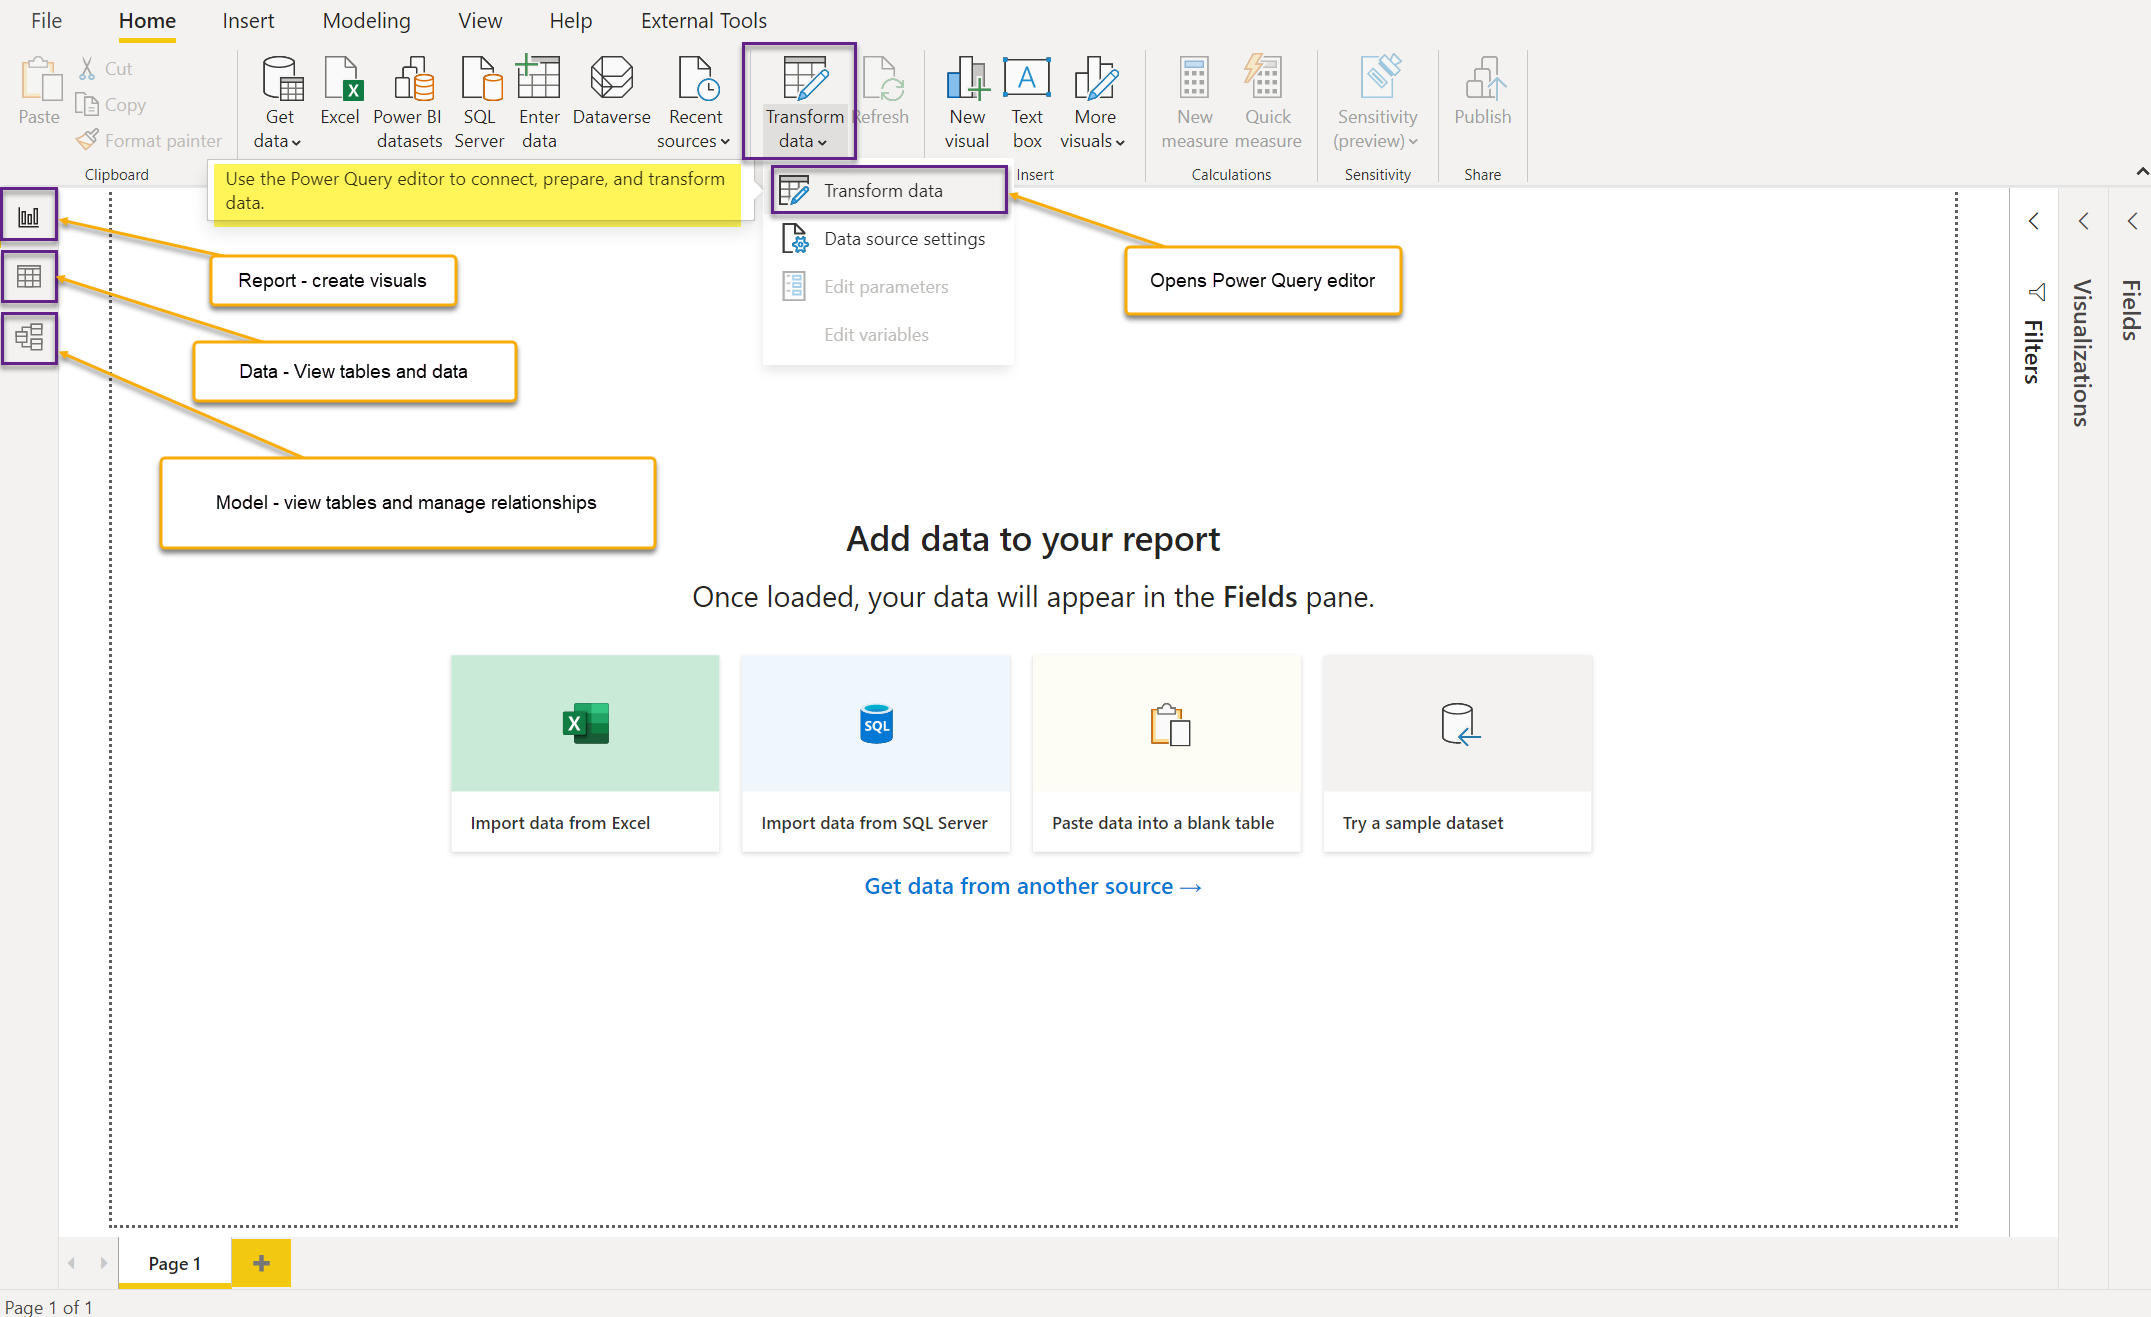
Install and run Power BI Desktop. Close the welcome screen and on the left side of Power BI Desktop, observe 3 icons, corresponding to 3 main views: Report, Data and Model.
Power BI Desktop also includes the Power Query editor, which opens in a separate window. Using Power Query we can load, clean and shape data.
We will check in detail all these views, as we progress with the Tournament Overview report. For now, it is important to understand what purpose they serve.
- Get data : In Query editor we can connect to data sources and do data transformations.
- Model creation : In the Model view we can view tables, edit properties and manage relationships.
- Model enhancement : In the Data view we can explore the data in each table.
We can enhance the model with calculated columns and measures. - Visual building : In the Report view we create visuals.
Calculated columns and measures can also be added from the report view.
What’s next
First things first, let’s open Power Query editor and start loading the wta_tennis data.
