In the previous post we have imported the wta_tennis data in Power BI. In the next couple of posts we will use Power Query to shape the data into the format and structure we need,
Common data shaping tasks are: rename/remove tables and columns, remove rows, changing data types, merge/append queries, pivoting/unpivoting, splitting column by delimiter, etc.
Many of the transformations in Power Query editor can be done using options in the ribbon bar. More complex transformations will require us to manually edit some code in Power Query M Formula Language.
M is a functional, case-sensitive language, optimized for writing data mashup queries.
In fact, any time we do transformations using the ribbon bar options in Power Query editor, M code is automatically generated for us in background.
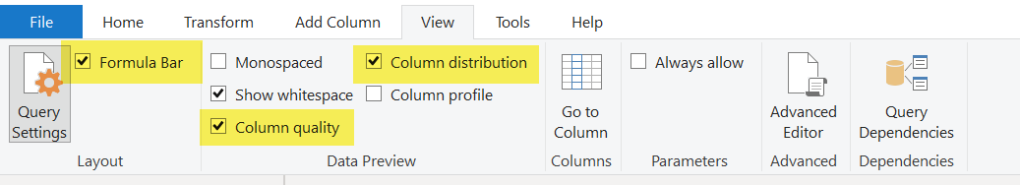
A good practice when just starting with Power Query, is to activate the formula bar so we can easily see the M code behind each transformation step. To activate the formula bar, go to File->Options and settings->Options and check the options as shown in the image below.

Choose Transform data from the Home ribbon bar to start Power Query in a new window. In the View menu check the setting Formula bar to view the M code for each transformation. Since you are here, also check Column distribution and Column quality (we will talk about it further down).
Let’s start with the Players query.
Players query
Select Players query in the list of Queries. Then, from the ribbon bar select Remove rows->Remove Top Rows and type 3 in the dialog window, then choose Ok. This Will remove the first 3 rows. We only want to keep the row corresponding to the .csv file.

Note the M formula that was generated for us: Table.Skip(Source, 3)

Click on the Binary column of the remaining row and note that several transformation steps were autogenerated: the content of the csv is loaded, first row is promoted to column headers and data types are automatically inferred.
1. Data profiling
Some data profiling capabilities are available in the query editor. We can see the column distribution, distinct and unique rows, or how many rows have errors. We can enable/disable this at any time in the View menu Column distribution / Column quality.

2. Remove and rename columns
We remove any column that we are not going to use. Do CTRL+click to select birth_date and hand columns, then right click to open the contextual menu and select Remove columns.

For the remaining four columns, double click the header to rename them: Player Id, First name, Last name and Country code respectively. Note the generated M code in the formula bar:
= Table.RenameColumns(#"Removed Columns",{{"player_id", "Player Id"}, {"first_name", "First name"}, {"last_name", "Last name"}, {"country_code", "Country code"}})
3. Custom columns
In the Tournament Overview report I want to be able to show the country flag for each player (see the post on Sketching the Power BI reports).
Currently, we have the country code column for each player in the Players table. We will create a new column, of type Image URL, which will store the URL to the country flag. We will get the URLs from the WTA website.
The image flag URLs on the WTA website, have the following pattern:
https://www.wtatennis.com/resources/v3.0.23/i/elements/flags/<CountryISO3Code>.svgFor example, the following URL https://www.wtatennis.com/resources/v3.0.23/i/elements/flags/can.svg is giving us Canada’s flag.
Obviously, to build this new columns, we need to use the values in the Country Code column. Select the Custum Column option in the Add column ribbon bar menu, and type the following M formula to contatenate the URL parts:
="https://www.wtatennis.com/resources/v3.0.23/i/elements/flags/" & Text.Lower([Country code]) & ".svg"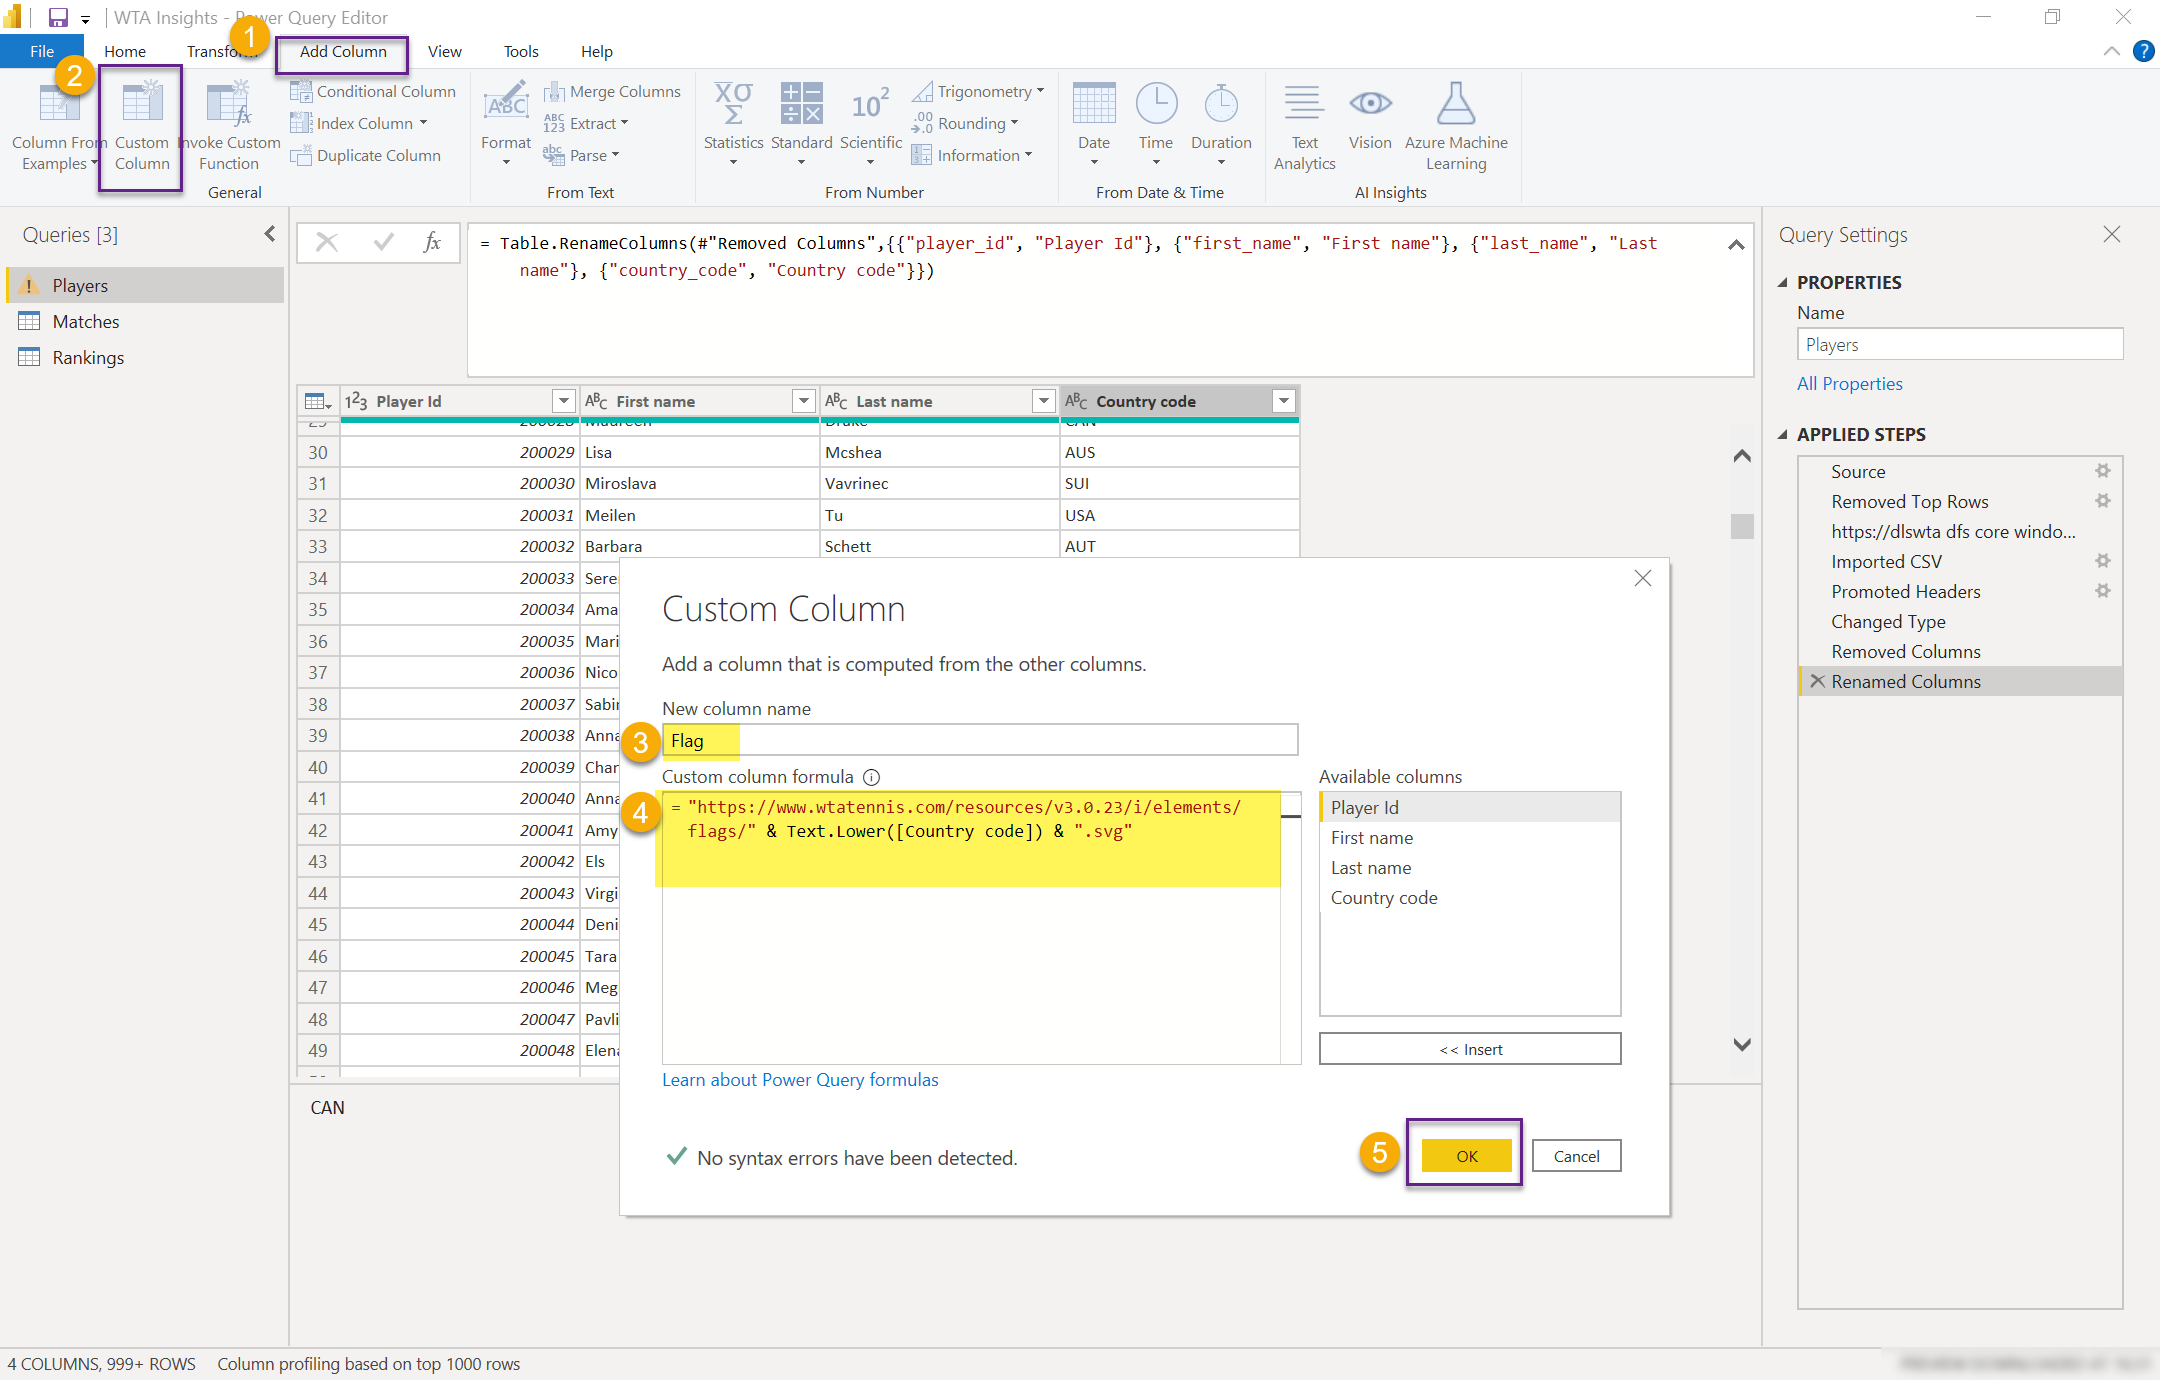
Add another custom column for the full name, defined as =[First name] & ” ” & [Last name]. Name the column Player name and delete the First name and Last name columns. Your screen should look like the image below.

If you want to view the M code for all the query steps, select Advanced Editor in the Home ribbon bar menu.

Click Save and Apply to save your changes.
What’s next
We continue to shape and transform the data, and the Matches query is next.
