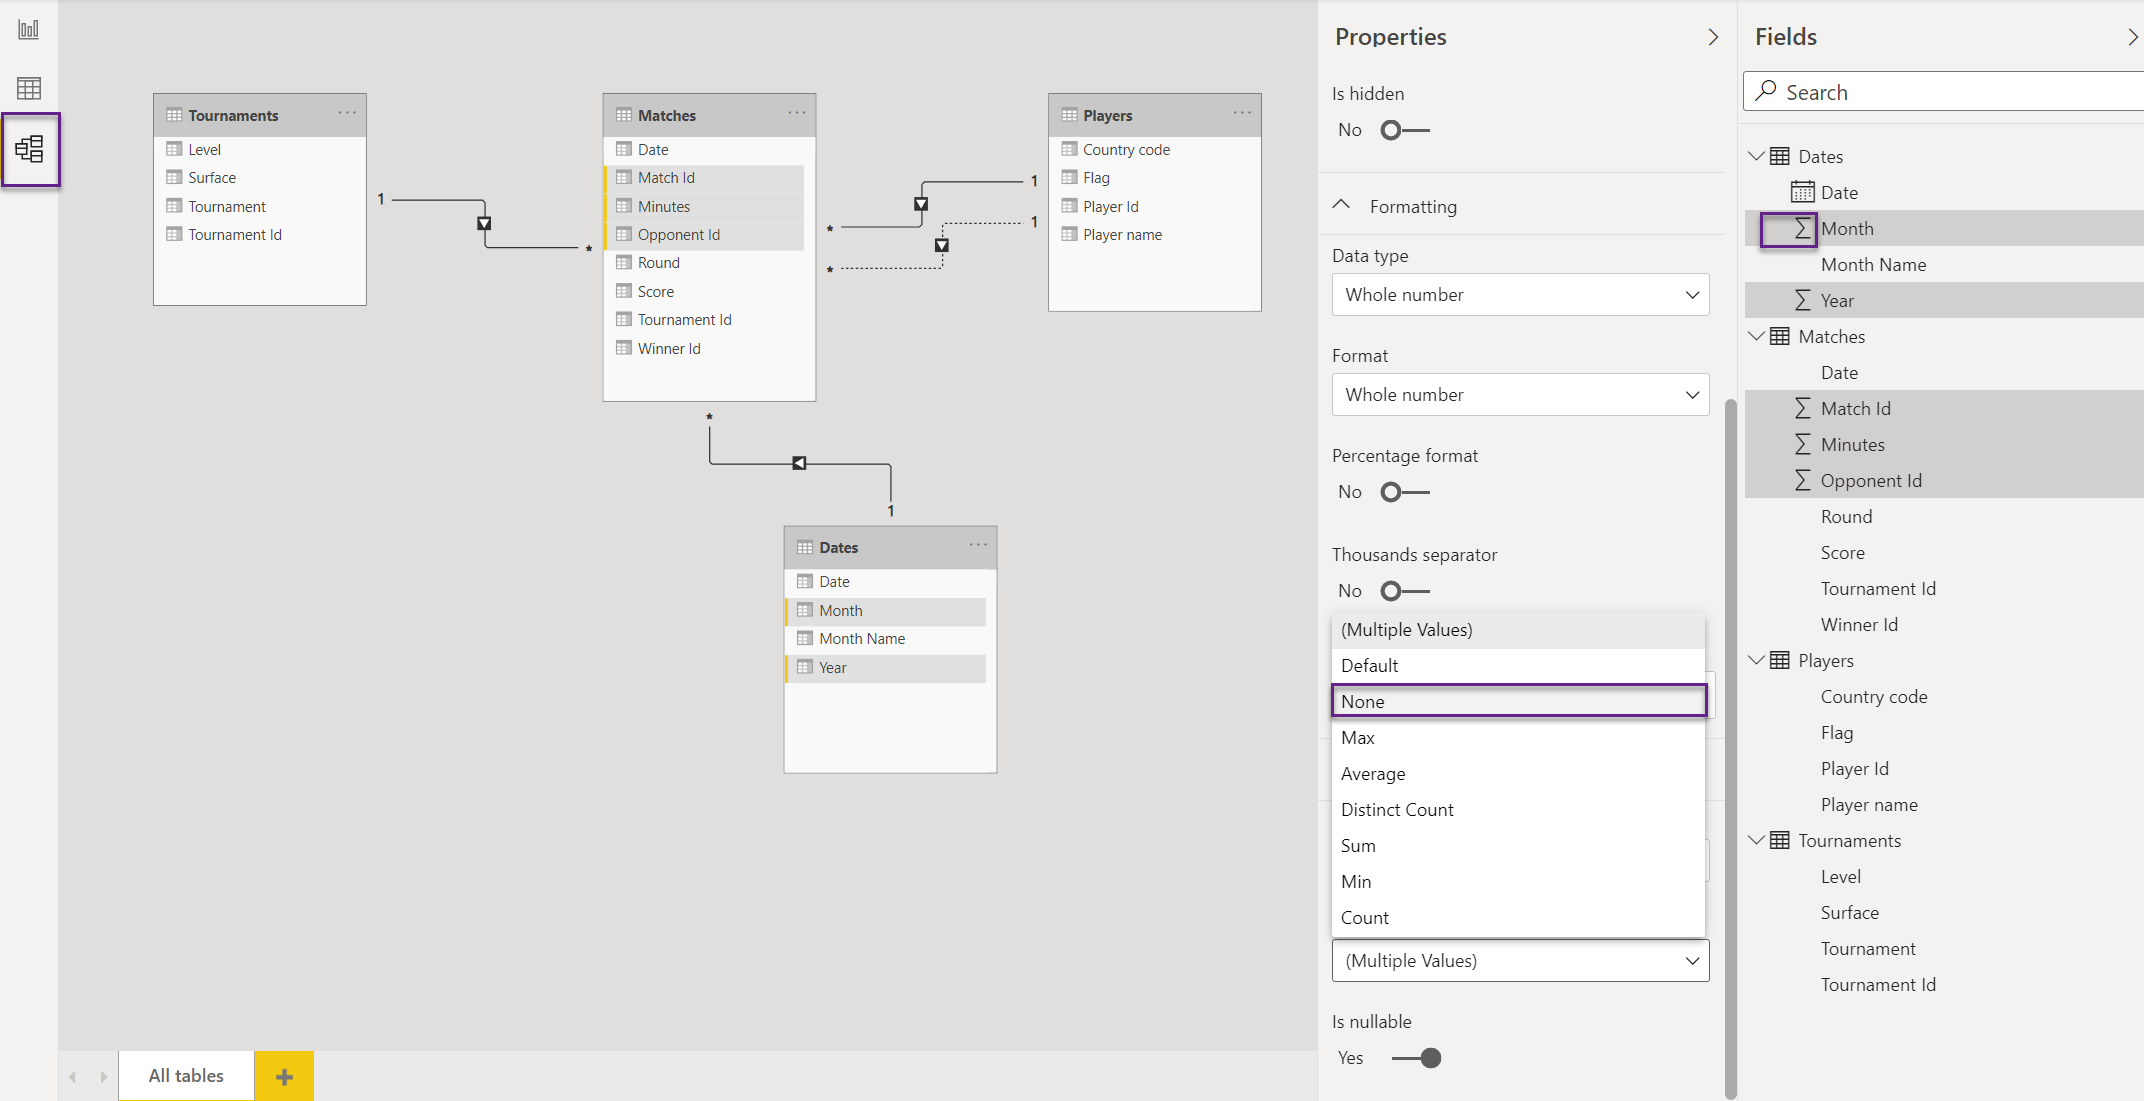
The Model view shows all the tables, columns and relationships in the model.
A data model brings facts and dimensions together. Relationships are connections between tables using columns from each, and can be: 1 to Many, 1 to 1 or Many to Many.
A star schema consists of one or more fact tables surrounded by dimensions, making the model look like a star. The fact table is on the many side of the relationship.
1. Create and manage relationships
Head over to the Model view in Power BI Desktop. The relationship between Matches (Tournament Id) and Tournaments (Tournament Id) tables was automatically detected. Let’s manually create the relationships between Matches (Winner Id) and Players (Player Id) and Matches (Date) and Dates (Date). Your screen should look like the image below.
The arrow on the relationship indicates the direction the filter is propagated.

Create also the relationship Matches (Opponent Id) and Players (Player Id) and note that the relationship is shown with a dotted line. This means that the relationship is inactive. There can only be one active relationship between two table at a moment.

If you need to change the active relationship, double click the dotted like and choose Make this relationship active.

2. Setting common properties
We can select multiple objects at once in the Model view. From the Fields list select all fields with a Σ sigma symbol and in the Properties pane choose Summarize by > None. This ensures that implicit measures won’t be created. We want to explicitly create the measures.
3. Categorize data
Select the Flag field and choose Data category > Image URL. This ensures that the field is view as an image in the report.
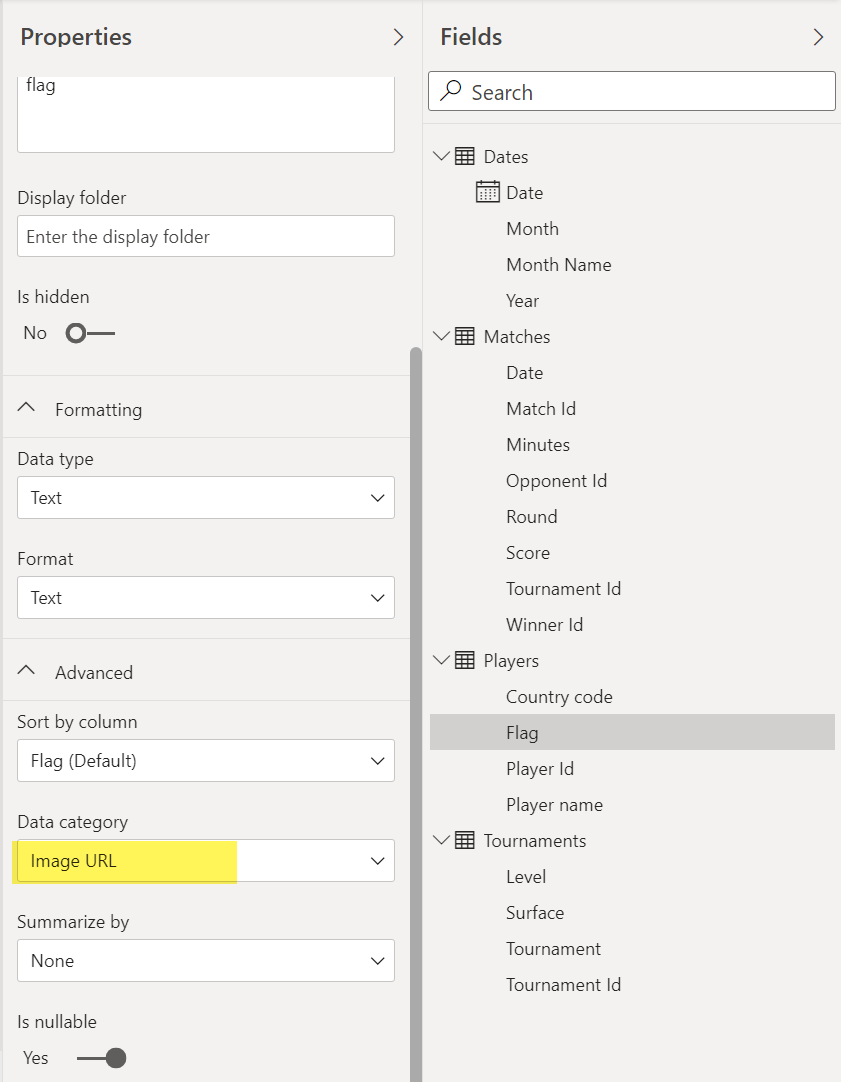
Data categorization can also be done from the Data or Report view.
What’s next
In the next post we will have a look at calculated columns and measures.
