Let’s talk DAX!
Data Analysis Expressions is the native formula and query language for Power BI Desktop, Power Pivot and SSAS Tabular models.

1. Calculated columns and Row context
We use DAX to create calculated columns. Whenever we create a calculated column a row context is also created, that allows the calculated column to perform an expression on a table row by row. In other words, the row context let’s the expression look at the values in the same row, and it only sees that row.
Let’s see how it works in practice. In the Matches table, the column Minutes shows the duration of the match in minutes. Let’s create a new column, for the duration, in a friendlier format (hours and minutes).
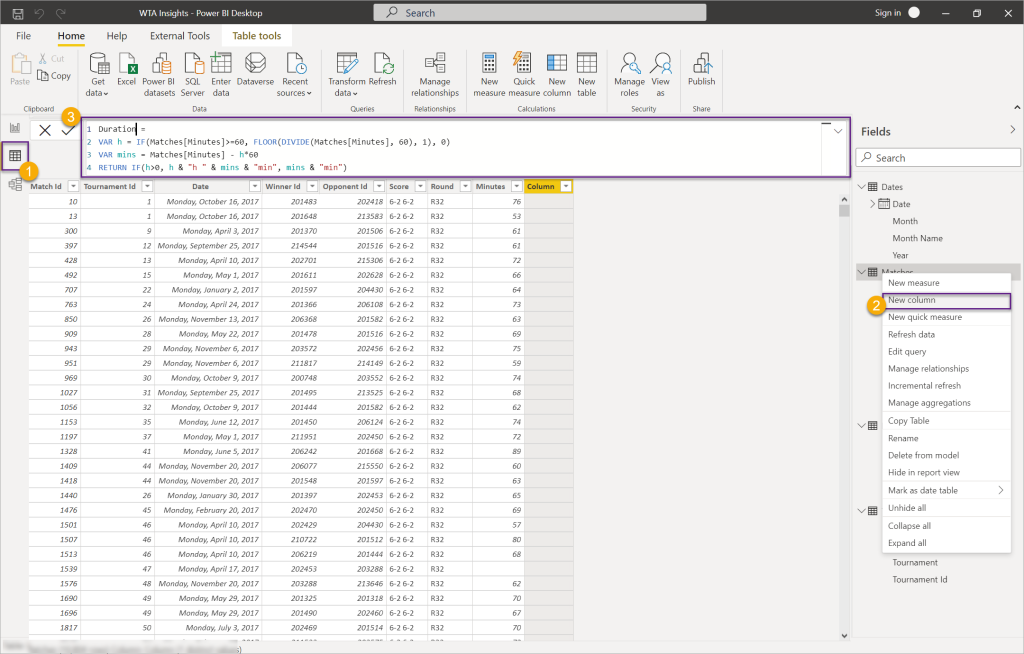
From the Data view, right-click the Matches table and choose New column. In the formula bar add the following DAX expression:
Duration =
VAR h =
    IF ( Matches[Minutes] >= 60, FLOOR ( DIVIDE ( Matches[Minutes], 60 ), 1 ), 0 )
VAR mins = Matches[Minutes] - h * 60
RETURN
    IF ( h > 0, h & "h " & mins & "min", mins & "min" )
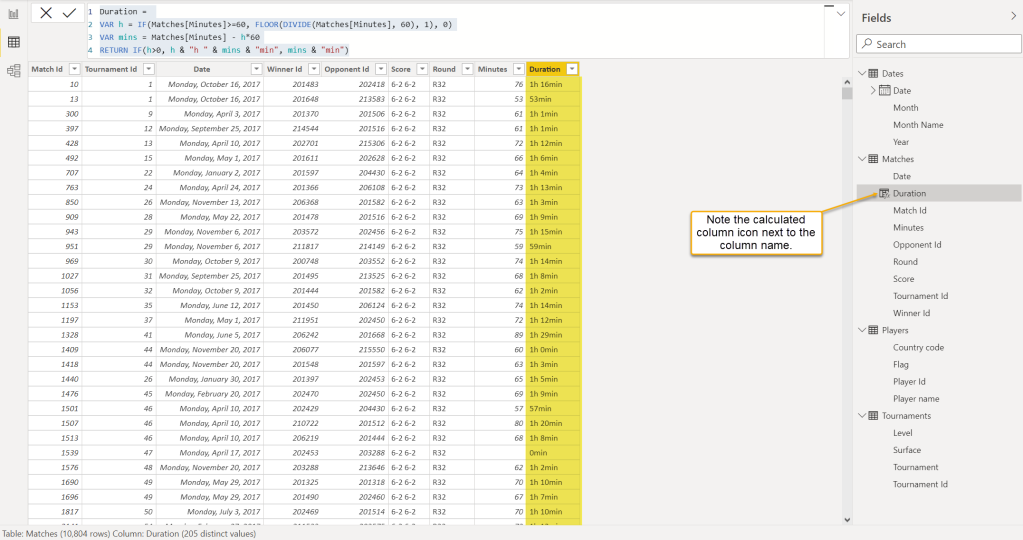
The expression works one row at a time, looks at the value of the Matches[Minutes] column of the current row, and performs the operations. The result should be as in the image below.
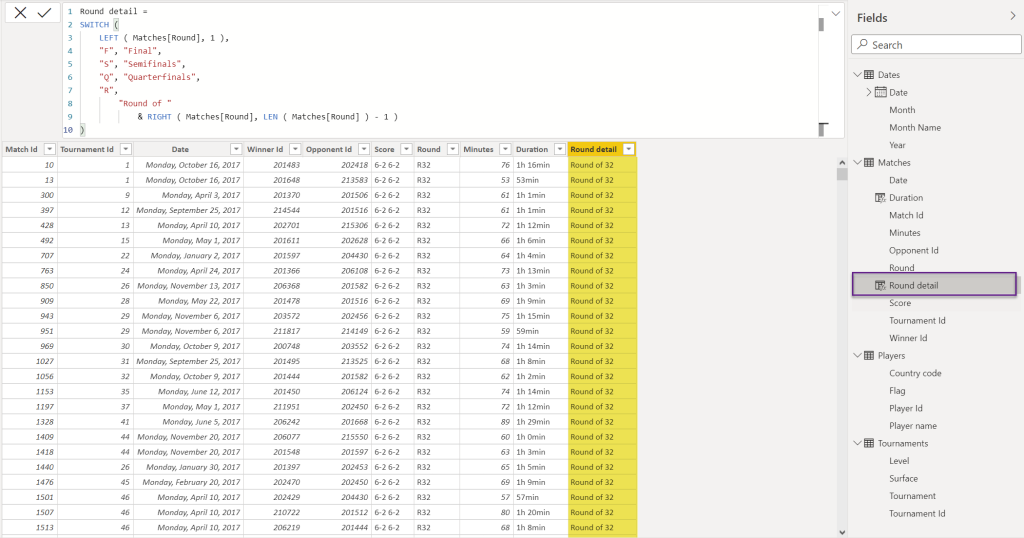
Use the example above to add another column for Round detail. This time we will use the value in the Round column to display Final (for F), Semifinals (for SF), Quarterfinals, etc. To achieve the result, we can use the SWITCH DAX function.
Round detail =
SWITCH (
    LEFT ( Matches[Round], 1 ),
    "F", "Final",
    "S", "Semifinals",
    "Q", "Quarterfinals",
    "R",
        "Round of "
            & RIGHT ( Matches[Round], LEN ( Matches[Round] ) - 1 )
)
Tip: you can use the online DAX formatter tool https://www.daxformatter.com/ to format your DAX expressions into clean, readable code.
Your screen should look like in the image below.
2. Measures and Filter context
Measures are always creates in DAX. They operate on multiple rows; it can be an entire table or a subset of it. Each measure is calculated independently and is evaluated against the data source.
The filter context is the totality of filters that are applied to a table before the result is returned to us. For example, the filter context is set through slicers, filters, other calculations, etc.
SELECTEDVALUE is a DAX filter function that returns the value when the context for a specified column has been filtered down to one distinct value.
For example, if we want to get the selected tournament and the year selection, we can use the DAX measure below.
Selected Tournament =
SELECTEDVALUE ( Tournaments[Location] ) & " "
    & SELECTEDVALUE ( Dates[Year] )
We can create a designated table for our measures, or we create a measure inside one of the other tables, but keep in mind that we refer to a measure without the table table.
3. The CALCULATE function
CALCULATE is the most important function in DAX. It allows to evaluate an expression within a modified filter context. We can use it to add, update or remove filter, or to convert row context to filter context.
If you recall from the previous post, we have two relationships between the Matches and Players tables. One active relationship Matches[Winner Id] – Players[Player Id], and one inactive relationship Matches[Opponent Id] – Players[Player Id].
We can temporarily change which relationship is active, using CALCULATE and the DAX function USERELATIONSHIP.
Create a new calculated column in the Matches table, as defined below, and name it Opponent.
Opponent =
CALCULATE (
    SELECTEDVALUE ( Players[Player name] ),
    CALCULATETABLE (
        Matches,
        USERELATIONSHIP ( Matches[Opponent Id], Players[Player Id] ),
        REMOVEFILTERS ( Players )
    )
)
The formula is temporarily changing the active relationship to Matches[Opponent Id] – Players[Player Id] and retrieving the opponent’s name from the Players table. You will have the following result.
Another, and simpler way to retrieve a value from another table inside a calculated column, is to use the DAX function LOOKUPVALUE.
Create another calculated column as defined below, to retrieve the opponent flag.
Opponent Flag =
LOOKUPVALUE ( Players[Flag], Players[Player Id], Matches[Opponent Id] )
You should have the following result.
Remember to set the Data category to Image URL.
What’s next
Let’s switch to the Report view and start adding some visuals.
Want to read more?
sqlbi: USERELATIONSHIP in calculated columns


