In this DAX-related post I will enhance the WTA Grand Slam data model with calculation groups.
But what exactly are calculation groups in Power BI?
Occasionally, you might need to add many similar measures to your model. Oftentimes, this is the case with time intelligence measures. For example, you define measures in your model to calculate the sales year-to-date (YTD), prior-year (PY), year-over-year (YoY); then you also want to perform these calculations against cost, profit, quantity and end up creating many similar measures that are difficult to maintain.
Calculation groups allows you to quickly create many similar measures and helps declutter the Fields pane.
But calculation groups have way more applications than just time intelligence! In this post I’ll show you how to use calculation groups to re-use DAX patterns in your model and how they interact with visuals when added in the Filters pane.
Tabular Editor & Calculation groups
Let’s head over to Power BI Desktop and open the WTA Grand Slam model. If you haven’t done so yet, you can also check my previous post on how to create the WTA Grand Slam data model in Power BI. The pbix file is available for download on my github.
Per the date I’m writing this post, you can not create calculation groups directly in Power BI Desktop. You need to install an external tool for this – Tabular Editor.
So, here’s what I want to achieve: I want to calculate how many grand slam tournaments a player won, and I also want to see this information broken down by tournament.
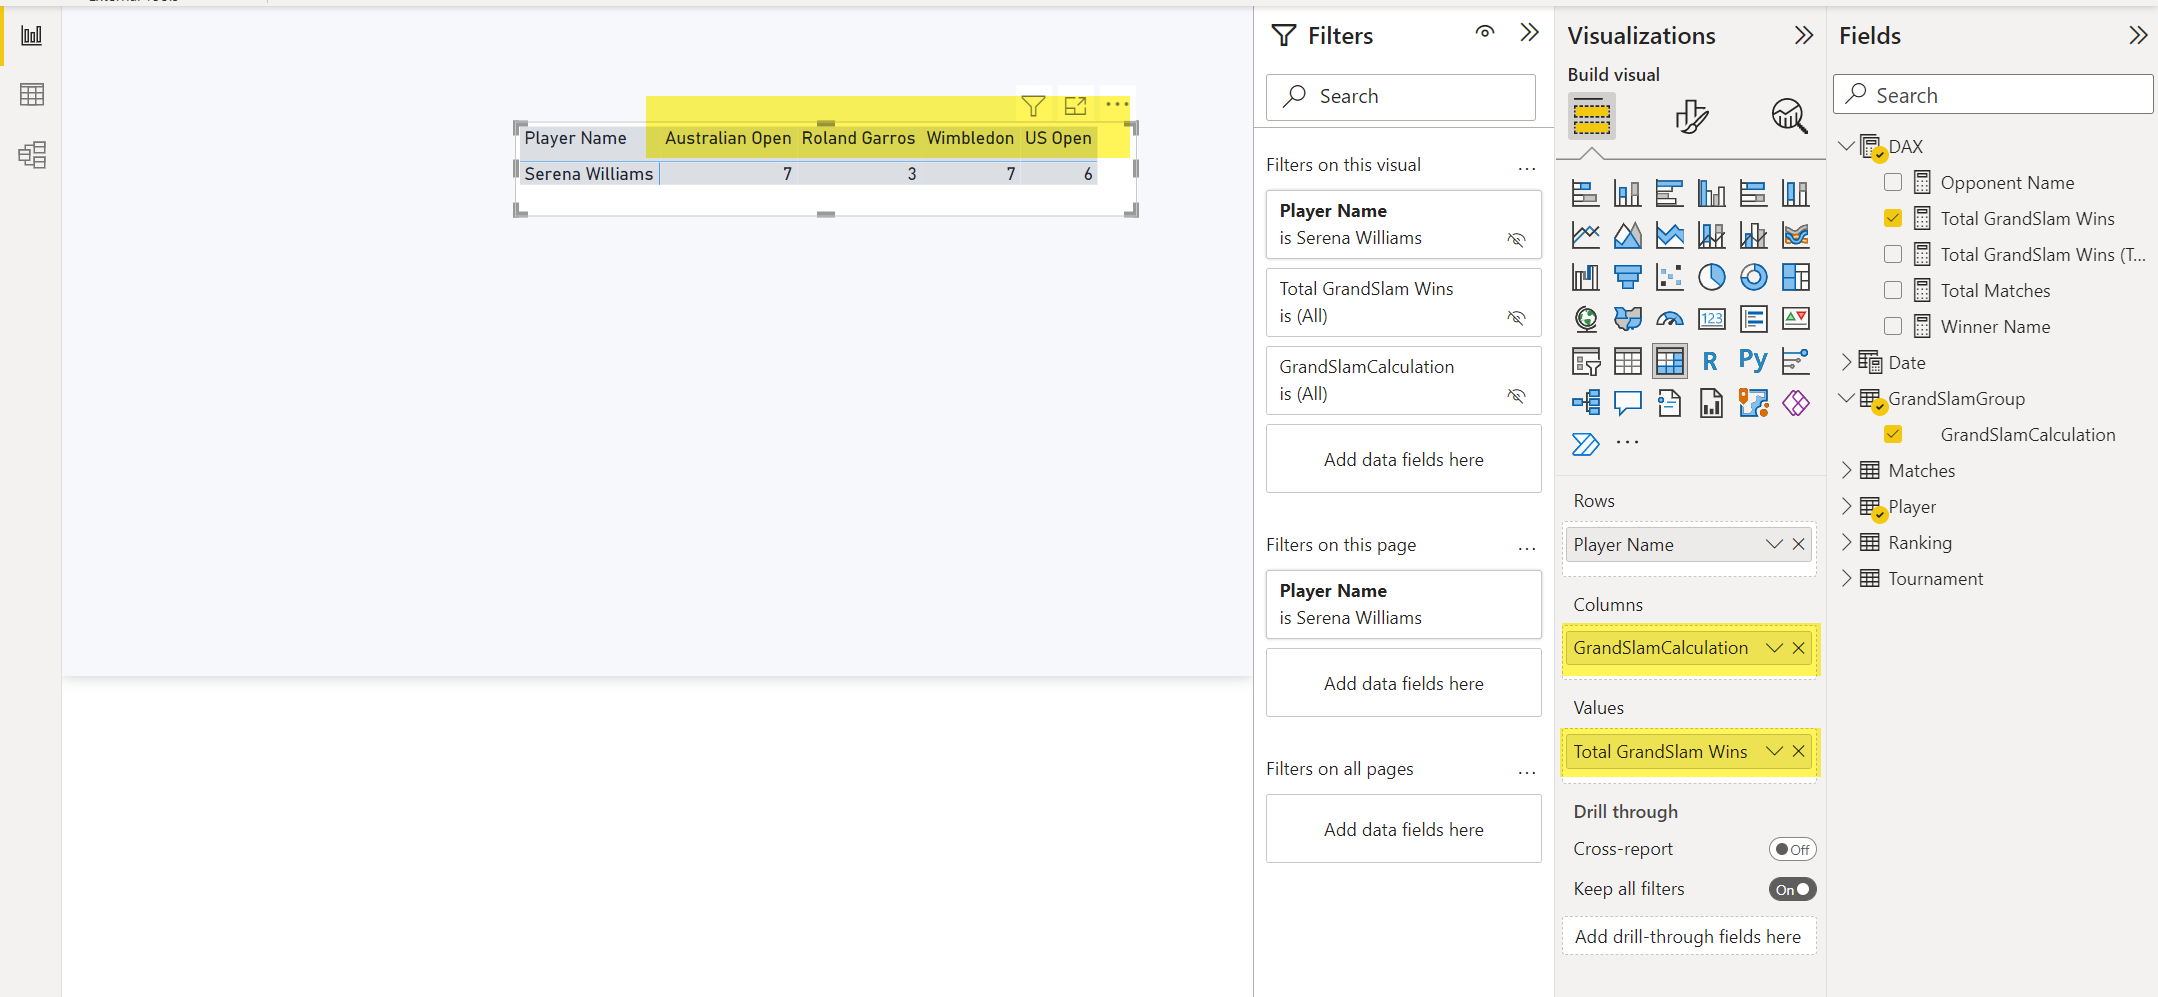
During her impressive career, Serena Williams won 23 grand slam titles, of which: 7 Australian Open, 3 Rolland Garros, 7 Wimbledon and 6 US Open.

I’ll begin by adding 3 new measures to the model.
- Total Matches – the total number of matches played.

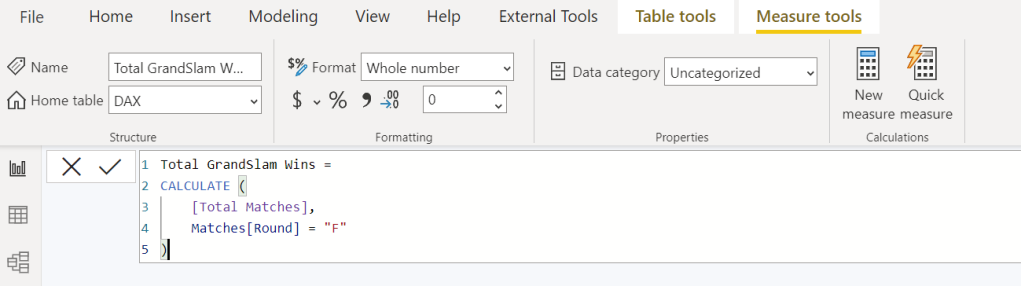
- Total GrandSlam Wins – the number of grand slam tournaments won.
- Total GrandSlam Wins (Text) – text measure that I want to display on a card visual.

Next, let’s add a calculation group with 4 calculation items, one for each grand slam tournament. Once you have installed Tabular Editor, you can launch it from he External Tools menu.

Right-click on the Tables in the Model tree-view and choose Create New>Calculation Groups. Name it GrandSlamGroup.
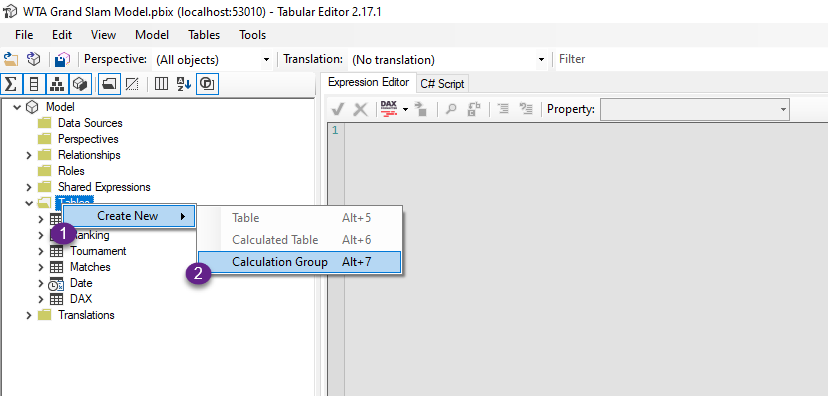
Create a calculation item and name it Australian Open. In the Properties pane give it an ordinal value of 0 (zero). In the Expression Editor type the following DAX, as in the image below. You can also click on the DAX Formatter icon to have your code nicely formatted. Then click on the check sign icon to lock the expression in place.
The DAX function SELECTEDMEASURE, specific to calculation items, returns a reference to the measure that’s currently in context when the calculation item is evaluated. We’ll see how it works shortly.

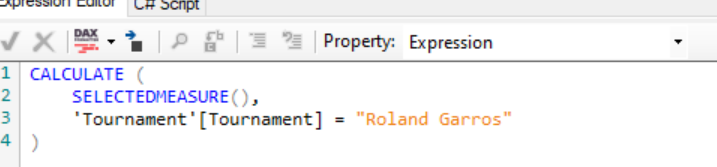
Similarly, add another three calculation items:
- Roland Garros
- Wimbledon
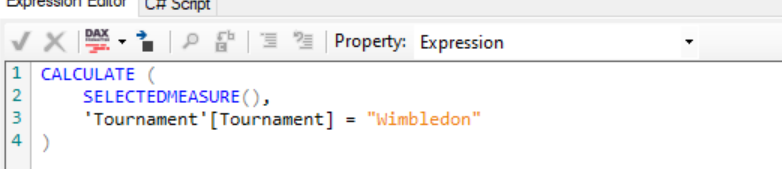
- US Open

When you’ve created all the items, click on the “Save the changes to the connected database” icon to propagate the changes in Power BI Desktop.

Switch back to Power BI Desktop, where a yellow banner will display. Select Refresh now, to refresh the model with the changes done in Tabular Editor.
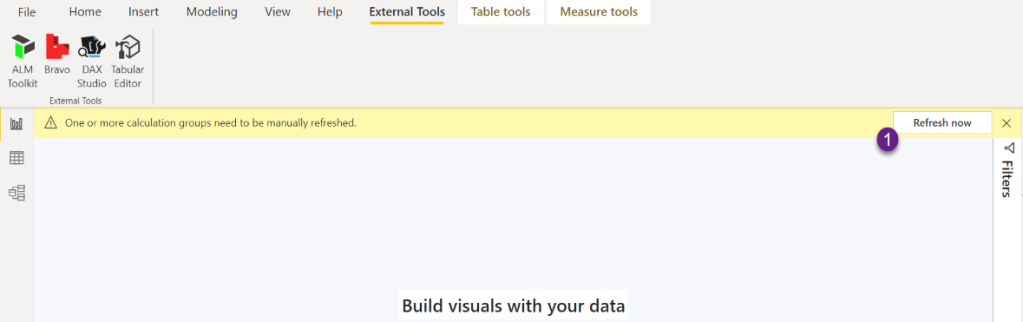
Refreshing will apply the changes by creating the calculation group as a model table. Then, it will load the calculation items as rows of data.
The calculation group is available in the Fields pane, and it looks like a regular a table. When you add the calculation group field to a visual, the visual will group by the calculation items.
To quickly test the calculation group, I’ve added in a matrix visual, the calculation group field on the Columns, and the measure Total GrandSlam Wins on the Values. The calculation item evaluates the measure currently in the context (Total GrandSlam Wins) as being the SELECTEDMEASURE.
We can also add calculation groups in the Filters pane and use it on a single visual. Let’s see how that works!
Below I’ve added a card visual to display the Total GrandSlam wins (Text) measure. At first, it shows the value Wins x23. Now drag the GrandSlamCalculation field in the Filters pane, Filters on this visual section. Select for example Australian Open. The card now shows Wins x7.

If you want to learn more about calculation groups, the article linked in the Resources section below presents 10 ways of using them in your reports. Have fun!
Resources
Microsoft Learn – Add DAX calculation groups to Power BI Desktop models
apexinsights – 10 ways you can use Calculation Groups in Power BI
